
Rhythmic Variability Between Young and Old Age Groups
Overview: This study examines the impact of a set of durational and intensity rhythmic metrics to classify speakers into young and old age groups. As shown in the result, deltaV, V% and stdevP stand out as the top predictors.
Methods: Computation modeling in R, Random forest, Decision tree
1. Introduction
The process of speech production undergoes intricate changes with aging, impacting the rhythmic characteristics of spoken language. There are multiple possible factors associated with changes, including age-related degenerative changes in the respiratory, laryngeal and supraglottic systems and neuromuscular control. Previous cross-sectional studies have already established associations between specific rhythmic characteristics and age. For instance, research conducted on Italian speakers by Pettorino and Pellegrino in 2014 [3] demonstrated that older adults exhibit an increased percentage of vocalization (%V) compared to their younger counterparts.
Similarly, studies into Zurich German have revealed that aging indeed influences speech rhythm. Older adults in this linguistic context have displayed higher %V, greater durational variability in CV intervals (deltaC and deltaV) both when the variability is calculated on the whole utterance and when it is computed between two consecutive intervals (rPVI_C) [4]. On the other hand, Pellegrino, He and Dellwo’s research [2] has quantified age-related differences in Zurich German regarding syllable intensity variability, specifically peak rather than mean syllable intensity variability. Between-syllable peak characteristics (VarcoP) and sequential between-syllable differences (nPVIp) have decreased with advancing age.
In summary, prior studies have explored both durational CV interval and syllable intensity variation in Zurich German in relation to aging.
2. Hypothesis
Based on the results of previous studies, we have selected a specific set of metrics, including {%V, deltaV, deltaC, rPVI_C, VarcoP, nPVIp, stdevP, rPVIp}, for the purpose of classifying two age groups: young and old adult speakers. Further, by employing the Decision Tree or Random Forest model, we can assess the feature importance of various metrics and determine the rhythmic metrics that have the greatest impact on classification.
H0: The selected set of metrics has no contribution to the classification of the two age groups with a Decision Tree or Random Forest model.
H1: The selected set of metrics contributes to the classification of the two age groups in certain extends with a Decision Tree or Random Forest model.
3. Methods
3.1 Speech materials
The same databases were selected for this study as the research conducted by Pellegrino, He and Dellwo in 2021 [2]. The database contains recordings from 10 older adult speakers and 16 younger adult speakers. The age of 10 older adult speakers (5 female, 5 male) ranges from 66 to 81 with mean age of 71.7 years and standard deviation of 4.9 years. All speakers were Zurich German monolinguals until the age of 6 years, completed their education in Zurich and lived in Zurich city or surroundings for at least five years before the recording session. The age of 16 younger adult speakers (8 female, 8 male) ranges from 18 to 32 with mean age of 30.3 years and standard deviation of 6.6 years.
The database contains recordings of 60 utterances read by each of the 26 speakers. The younger speakers were recorded for the TEVOID corpus [1]. And older speakers were later recorded with identical methods and equipment. Materials are selected so that there are no audible pauses, segment or syllable elisions, or pronunciation errors in any of the recordings. They were all declarative sentences of between 4 and 22 syllables. In summary, 1560 utterances were analyzed, 600 of which were generated by older speakers (60 utterances * 10 older adults) and 960 by young speakers (60 utterances * 16 young adults) [2].
3.2 Corpus annotation and computation of rhythmic metrics
Corpus annotation for rhythmic analysis
Annotations of CV intervals, consonant and vowel segments were already annotated using Praat’s CV tier creator, with diverse durational variability metrics extracted from the annotated CV intervals using Duration Analyzer. In the present study we focus mainly on metrics: %V, deltaV, deltaC, rPVI_C.
The corpus is already segmented in syllables, and syllable intensity peaks. Based on the TextGrids, Intensity Analyzer was utilized to extract rhythmical metrics of our study interests, including VarcoP, nPVIp, stdevP and rPVIp.
Metrics selected
In previous studies, durational metrics including V%, deltaV, deltaC and rPVI_C were found to yield higher values in the older group, showing an upward trend with age. Whereas, intensity metrics like VarcoP and nPVIp decreased with age growth. Meanwhile, certain durational metrics (varcoV, varcoC, nPVI_V) and syllable mean intensity metrics (varcoM, nPVIm) did not show important differences between the old and young groups [4].
To compare the contribution of different metrics, including both durational metrics and intensity metrics on age group classification, we selected the following set of metrics as a set: {%V, deltaV, deltaC, rPVI_C, VarcoP, nPVIp, stdevP, rPVIp}, where %V, deltaV, deltaC, and rPVI_C are durational features while VarcoP, nPVIp, stdevP, rPVIp are intensity features.
3.3 Computational Modeling in R
Data preparation and partitioning
The study merged two datasets containing consonant-vowel (CV) measures and intensity variability, respectively. The new dataset was then pruned to include only relevant rhythmic metrics as determined by our research hypothesis. It was split into training (80%) and testing (20%) sets based on the response variable “Age”. This resulted in the train dataset, used for training the model, and the test dataset, reserved for evaluating its performance.
Class balancing
The initial class distribution revealed that the “o” (older) class accounted for 38.4% of the data, while the “y” (younger) class constituted 61.6%. To rectify this imbalance, oversampling was implemented on the training set to ensure a balanced representation of both age groups.
Computational models
The classification of speakers into age groups was approached using multiple models in R, including Decision Tree, Conditional Inference Tree and Random Forest. For the Random Forest model, the best hyperparameter combinations were found via cross-validation to optimize for accuracy. Model performance was then assessed based on accuracy and the area under the receiver operating characteristic (ROC) curve (AUC).
4. Results
4.1 Model comparison
Models were compared based on their accuracy and ROC/AUC. The Random Forest model demonstrated superior performance with an accuracy of 73.31% and an AUC value of 0.829, outperforming the Decision Tree and Conditional Inference Tree models.
| Model | Accuracy | AUC |
| Recursive Partitioning and Regression Trees (rpart) | 0.6752412 | 0.73 |
| Conditional Inference Trees (ctree) | 0.7009646 | 0.784 |
| Simplified Conditional Inference Trees (simple ctree) | 0.7009646 | 0.726 |
| Random Forest | 0.7331190 | 0.829 |
4.2 Random Forest model summary
Confusion matrices and accuracy measures
| Prediction\Reference | old | young |
| old | 90 | 54 |
| young | 29 | 138 |
Key statistics:
- Accuracy : 0.7331
- 95% CI : (0.6803, 0.7815)
- No Information Rate : 0.6174
- P-Value [Acc > NIR] : 1.117e-05
The confusion matrix shows that the Random Forest model has predicted the “Old” class correctly 90 times and incorrectly 54 times, leading to a relatively higher number of false positives. For the “Young” class, the model predicted correctly 138 times and incorrectly 29 times, indicating a lower number of false negatives. The statistical results show that the Random Forest model demonstrates good predictive power, significantly surpassing the No Information Rate. It is more effective at identifying the “Young” class than the ‘Old’ class, as indicated by the lower number of false negatives compared to false positives. The 73.31% accuracy is statistically significant, and the high confidence interval suggests that this model’s performance is reliably estimated.
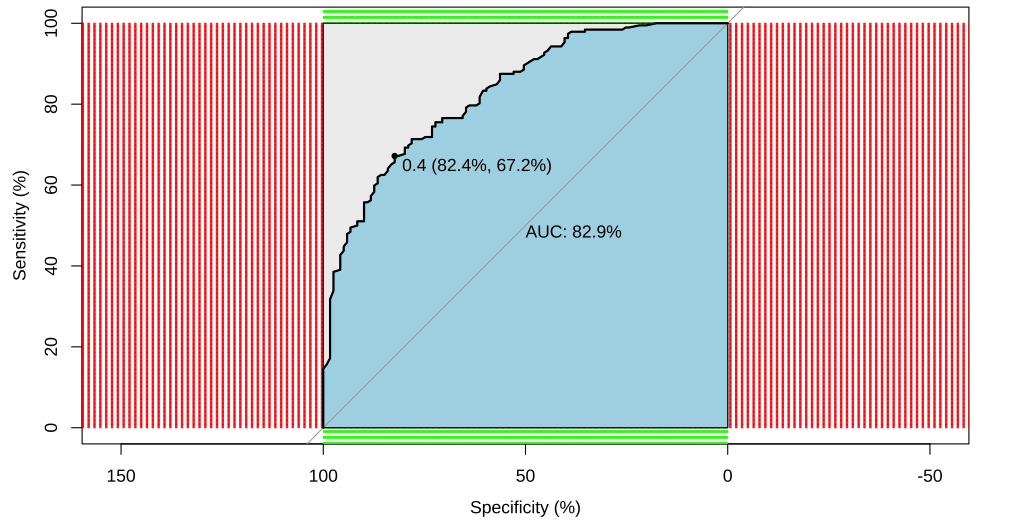
Figure 1: ROC Curve for Random Forest
The ROC curve shows a relatively superior high AUC value of the Random Forest model: 82.9%, indicating the model’s strong ability to differentiate young and old adult speakers.
Feature importance
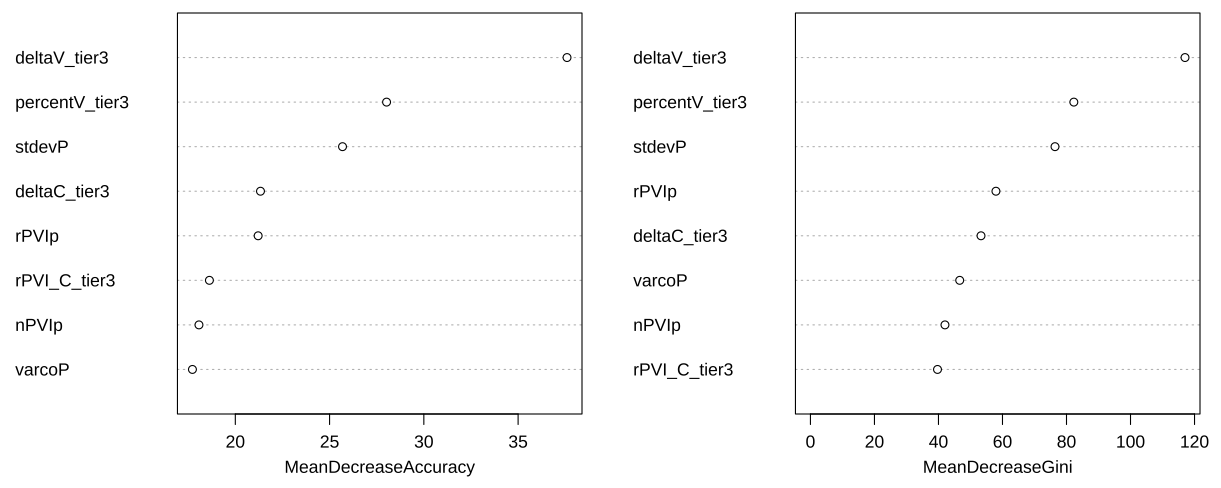
Figure 2: Feature Importance
Since Random Forest is the strongest model in classifying the two age groups with the selected set of metrics, we used it to analyze the feature importance of each metric in the classification task.
The Mean Decrease Accuracy indicates how much the accuracy decreases when a feature is excluded, suggesting its relative importance in prediction. deltaV is the most significant predictor, followed by V% and stdevP. While rPVI_C, nPVIp, VarcoP are less critical in the Random Forest model’s prediction. The Mean Decrease Gini measures each feature’s contribution to the homogeneity of the nodes and leaves in the model. deltaV, V% and stdevP also rank on the top with high Gini decreases, which align with the Mean Decrease Accuracy result. Conversely, VarcoP, rPVI_C, nPVIp contribute less to node purity, as reflected by their lower Mean Decrease in Gini scores.
Furthermore, to obtain a general understanding of the relative contributions of durational CV interval variability and syllable intensity variability, we summed up the feature importance scores for all metrics within these two sets. The total importance of the durational interval variability set (including %V, deltaV, deltaC, and rPVI_C) is 98.58 for Mean Decrease Accuracy and 287.92 for Mean Decrease Gini, both surpassing the total importance of the syllable intensity variability set (including stdevP, varcoP, rPVIp, and nPVIp), which scores 81.34 and 224.26 respectively.
In summary, the feature importance metrics suggest that deltaV, V% and stdevP stand out as the top predictors in the Random Forest model, significantly influencing the classification process. In addition, when comparing the two sets, durational CV interval variability metrics exhibit a greater overall impact than syllable intensity variability metrics based on the given feature importance scores.
5. Discussion
Our study results offer valuable insights into the rhythmic variability between young and old adult speakers. The Random Forest model outperformed the other models in terms of accuracy, proving to be a robust classifier for distinguishing between the two age groups based on the selected rhythmic metrics. This finding supports our alternative hypothesis (H1) that the set of chosen metrics contributes to the classification of age groups in speech analysis.
In parallel with earlier research on Zurich German, our findings reinforce the notion that aging significantly impacts speech rhythm. In the Zurich German context, the significant impact of features like %V (percentage of vocalization) and deltaV (durational variability of vowels) on the classification decision aligns with previous research findings, which indicate that these features tend to yield higher values in older adults. This correlation might reflect age-related physiological changes in the speech mechanism. The prominence of stdevP (standard deviation of syllable intensity peaks) in our findings also suggests that intensity modulation within speech plays a role in age classification. This difference between young and old age groups may be attributed to age-related alterations in mouth opening, as documented in previous research [2], where greater differences between open and closed mouth positions can result in increased peak variability while maintaining similar overall syllable intensity.
On the other hand, the relatively low importance of features such as VarcoP (variability of peak intensity), rPVI_C (raw Pairwise Variability Index for consonants), and nPVIp (normalized Pairwise Variability Index for syllable intensity peaks) is somewhat surprising, as it appears to contradict previous studies that reported significant age-related changes in these metrics. This discrepancy may be attributed, in part, to the limitations of our study. As Pellegrino has pointed out [5], it is challenging to disentangle the effects of aging from other factors when interpreting rhythmic differences among younger and older adults for studies relying on single-occasion observations and groups individuals of similar age together, because they potentially overlook the substantial variability in life experiences and aging rates among subjects. As a result, more extensive longitudinal data is needed for future research.
6. Conclusion
In conclusion, our study provides evidence that certain rhythmic metrics play a vital role in classifying speakers into age groups with Random Forest. However, the study’s limitations also warrant discussion. The sample size, while sufficient for preliminary analysis, could be expanded in future work to validate the findings across a broader population. Additionally, exploring alternative feature sets could yield a more comprehensive understanding of age-related speech changes.
7. References
[1] Dellwo, V., Leemann, A., & Kolly, M. J. (2012). Speaker idiosyncratic rhythmic features in the speech signal. In: Interspeech 2012, Portland (OR), USA, 9 September 2012 - 13 September 2012. Interspeech Conference Proceedings, 1-4. https://doi.org/10.5167/uzh-68554.
[2] Pellegrino, E., He, L., & Dellwo, V. (2021). Age-Related Rhythmic Variations: The Role of Syllable Intensity Variability. Travaux Neuchâtelois de Linguistique, no. 74, 167–185. https://doi.org/10.26034/tranel.2021.2924.
[3] Pettorino, M., & Pellegrino, E. (2014). Age and Rhythmic Variations: A Study on Italian. In Interspeech 2014, 1234–1237. ISCA. https://doi.org/10.21437/Interspeech.2014-310.
[4] Pellegrino, E., He, L., & Dellwo, V. (2018). The Effect of Ageing on Speech Rhythm: A Study on Zurich German. Proc. Speech Prosody 2018, 133-137. https://doi.org/10.21437/SpeechProsody.2018-27.
[5] Pellegrino, E. (2019). The effect of healthy aging on within-speaker rhythmic variability: A case study on Noam Chomsky. Loquens, 6(1):e060.